Today, we’re introducing NovaAtom-Lite, Geodesic’s most capable model yet for all-atom structure prediction. Given the sequences of a biomolecular assembly’s protein, DNA and RNA chains, together with its small-molecule ligands, NovaAtom-Lite predicts the position of every heavy atom, with confidence for each residue and each pair of residues. Many drug-discovery questions start with a structure, and NovaAtom-Lite’s clearest advantage over other models is at the interfaces they turn on: between antibodies and their protein antigens, and between proteins and small-molecule ligands. On these critical drug-discovery tasks, NovaAtom-Lite outperforms both IsoDDE and AlphaFold 3, setting a new bar for molecular structure prediction. NovaAtom-Lite is trained on structures released up to September 30, 2021, the same cutoff as AlphaFold 3[1], and every benchmark below is drawn from structures released after that date.
FoldBench, antibody–antigen
79.07%
of FoldBench’s 172 antibody–antigen interfaces predicted correctly (DockQ ≥ 0.23) by NovaAtom-Lite’s top-ranked prediction, chosen from 25 per target.
What NovaAtom-Lite predicts.
Proteins, nucleic acids and small molecules, folded together in one prediction.
- N:8QABThree helices
- O:8Q1MAChBP pentamer
- V:8A51BRME1 helices
- A:7Z5KMYF5 dimer
- A:8IPGHP101 peptides
- T:8P6KM3 protein
- O:9ZENNucleosome DNA
- M:9ZENHistone H3 pair
It reads
- Protein
- Any number of chains, including modified and non-standard residues.
- DNA and RNA
- Single- and double-stranded DNA, structured RNA, with their protein partners.
- Ligands
- Small molecules, cofactors, metals and ions, by chemical component code or SMILES.
It returns
- Coordinates
- Every heavy atom, several independent samples per target, ranked.
- pLDDT
- Per-residue confidence in the local structure.
- PAE and ipTM
- Expected error between residues, and per-interface reliability.
It also takes constraints and hints
Cyclic and covalent bonds are built into the input; contacts and pockets are hints the model weighs, not constraints.
-
Cyclic peptides
Mark a peptide as cyclic, and the bond that closes the ring is added for you.
-
Covalent bonds
Link two atoms, as for a covalent inhibitor, a glycan or a cross-link.
-
Contacts and pockets
Point to residues that touch, or to the pocket where a ligand binds.
How NovaAtom-Lite performs.
Structure prediction across interfaces and monomers, against published baselines.
NovaAtom-Lite on FoldBench
FoldBench[3] is a low-homology benchmark of 1,522 biological assemblies from PDB entries deposited between January 13, 2023 and November 1, 2024, filtered for similarity to AlphaFold 3’s training set. We chart eight of its tasks: five interface types scored by success rate, and protein, DNA and RNA monomers scored by LDDT.
Charted: antibody–antigen, protein–ligand, protein–protein, protein–RNA and protein–DNA interfaces, and protein, DNA and RNA monomers.
- 2023–2024 PDB deposit window, January 13, 2023 to November 1, 2024
- 1,522 biological assemblies in FoldBench
- 8 tasks charted
Antibody–antigen
- DockQ ≥ 0.80
- 0.49 ≤ DockQ < 0.80
- 0.23 ≤ DockQ < 0.49
- NovaAtom-Lite, sample 172
- IsoDDE, sample 172
- OpenDDE, sample 104 entries / 160 clusters
- SeedFold, the task's full set, 172; its report states no count
- ESMFold2, sample 172
- Protenix-v1, sample 104 entries / 160 clusters
- AlphaFold 3, sample 167
- Boltz-1, sample 164
Protein–ligand
- NovaAtom-Lite, sample 558
- IsoDDE, sample 558
- AlphaFold 3, sample 547
- SeedFold, the task's full set, 558; its report states no count
- Protenix-v1, sample 558
- ESMFold2, sample 511
- OpenDDE, sample 558
- Boltz-1, sample 476
Protein monomer
- NovaAtom-Lite, sample 334
- ESMFold2, sample 333
- OpenDDE, sample 330
- SeedFold, the task's full set, 334; its report states no count
- Protenix-v1, sample 330
- AlphaFold 3, sample 334
- Boltz-1, sample 330
Protein–protein
- DockQ ≥ 0.80
- 0.49 ≤ DockQ < 0.80
- 0.23 ≤ DockQ < 0.49
- NovaAtom-Lite, sample 279
- OpenDDE, sample 279
- ESMFold2, sample 278
- IsoDDE, sample 279
- SeedFold, the task's full set, 279; its report states no count
- AlphaFold 3, sample 266
- Protenix-v1, sample 237 entries
- Boltz-1, sample 252
Protein–RNA
- DockQ ≥ 0.80
- 0.49 ≤ DockQ < 0.80
- 0.23 ≤ DockQ < 0.49
- NovaAtom-Lite, sample 70
- OpenDDE, sample 70
- ESMFold2, sample 39
- SeedFold, the task's full set, 70; its report states no count
- AlphaFold 3, sample 69
- Boltz-1, sample 58
Protein–DNA
- DockQ ≥ 0.80
- 0.49 ≤ DockQ < 0.80
- 0.23 ≤ DockQ < 0.49
- NovaAtom-Lite, sample 330
- AlphaFold 3, sample 317
- ESMFold2, sample 273
- OpenDDE, sample 322
- SeedFold, the task's full set, 330; its report states no count
- Boltz-1, sample 310
DNA monomer
- NovaAtom-Lite, sample 14
- AlphaFold 3, sample 14
- OpenDDE, sample 14
- SeedFold, the task's full set, 14; its report states no count
- ESMFold2, sample 14
- Boltz-1, sample 14
RNA monomer
- NovaAtom-Lite, sample 15
- OpenDDE, sample 15
- AlphaFold 3, sample 15
- SeedFold, the task's full set, 15; its report states no count
- ESMFold2, sample 15
- Boltz-1, sample 15
NovaAtom-Lite’s values come from five seeds of five samples per target, scoring the top-ranked prediction. NovaAtom-Lite leads the two interface tasks this release is aimed at — 79.07% on antibody–antigen against 75.58% for IsoDDE, and 77.06% on protein–ligand against IsoDDE’s 75.99% — and on both the step down to the third model is the larger one: 5.6 points on antibody–antigen, 11.1 on protein–ligand. AlphaFold 3, in FoldBench’s own evaluation, reaches 47.90% and 64.90% on the same two tasks. General protein–protein interfaces are closer, 75.63% against 76.9% for OpenDDE and 76% for ESMFold2, with five models inside three points, and protein monomers are level across the field, every model here between 0.870 and 0.891 LDDT. Antibody–antigen is where the models still differ most, from 33.54% to 79.07% across the eight drawn; monomer folding is where they no longer do. The counts under the bars differ, because each report scored the targets it had, so read a gap of a point or two as a tie. The margin grows in relative terms as the bar is raised: against AlphaFold 3, NovaAtom-Lite is 1.7 times its success rate at DockQ ≥ 0.23 and 2.2 times at ≥ 0.80, where it reaches 41.28% against 19.2%. More than half the antibody–antigen interfaces it gets right are at that quality, where two in five of AlphaFold 3’s are. A bar drawn solid is a model whose report gives no split.
- #1 on 3 tasks Antibody–antigen, protein–ligand, protein monomer
- Top 3 on 7 / 8 In the top three on 7 of the 8 FoldBench tasks in the table below
- +3.49 / +1.07 pts Over IsoDDE on antibody–antigen / protein–ligand, as IsoDDE’s developers report[2]
All eight tasks at a glance
| Task | NovaAtom-Lite | IsoDDE[2] | OpenDDE[4] | SeedFold[5] | ESMFold2[6] | Protenix-v1[7] | AlphaFold 3[3] | Boltz-1[3] |
|---|---|---|---|---|---|---|---|---|
| Antibody–antigen172 interfaces | 79.07 (best in row) | 75.58 | 70.0, sample 160 | 53.2 | 53 | 52.3, sample 160 | 47.90, sample 167 | 33.54, sample 164 |
| Protein–ligand558 interfaces | 77.06 (best in row) | 75.99 | 60.1 | 63.12 | 61, sample 511 | 62.5 | 64.90, sample 547 | 55.04, sample 476 |
| Protein monomer334 chains | 0.891 (best in row) | not reported | 0.890, sample 330 | 0.889 | 0.890, sample 333 | 0.886, sample 330 | 0.880 | 0.870, sample 330 |
| Protein–protein279 interfaces | 75.63 | 74.19 | 76.9 (best in row) | 74.03 | 76, sample 278 | 72.7, sample 237 | 72.93, sample 266 | 68.25, sample 252 |
| Protein–RNA70 interfaces | 65.71 | not reported | 73.5 (best in row) | 65.31 | 72, sample 39 | not reported | 62.32, sample 69 | 56.90, sample 58 |
| Protein–DNA330 interfaces | 74.24 | not reported | 76.1, sample 322 | 72.60 | 79, sample 273 | not reported | 79.18 (best in row), sample 317 | 70.97, sample 310 |
| DNA monomer14 chains | 0.521 | not reported | 0.504 | 0.499 | 0.470 | not reported | 0.530 (best in row) | 0.340 |
| RNA monomer15 chains | 0.620 | not reported | 0.660 (best in row) | 0.590 | 0.580 | not reported | 0.610 | 0.440 |
Each value is the one its bar shows above. A dash means not reported, never zero. Small figures give the sample a value was computed on when it is not the task’s full set, given under each task. Bold marks the best value in each row.
Test-time scaling on FoldBench antibody–antigen
Ranking the prediction the model’s own score ranks first
| Seeds | DockQ ≥ 0.23 | DockQ ≥ 0.49 | DockQ ≥ 0.80 |
|---|---|---|---|
| 1 | 74.3% (95% interval 66.9 to 81.4) | 65.4% (95% interval 57.0 to 73.3) | 41.0% (95% interval 32.6 to 48.8) |
| 2 | 76.3% (95% interval 69.2 to 83.1) | 67.5% (95% interval 59.3 to 75.6) | 42.0% (95% interval 34.3 to 50.0) |
| 5 | 78.3% (95% interval 71.5 to 84.9) | 69.5% (95% interval 61.6 to 76.7) | 43.4% (95% interval 34.9 to 51.2) |
| 10 | 79.9% (95% interval 73.3 to 86.0) | 70.9% (95% interval 63.4 to 77.9) | 44.1% (95% interval 36.0 to 52.3) |
| 20 | 81.2% (95% interval 75.0 to 87.2) | 71.8% (95% interval 64.5 to 79.1) | 44.8% (95% interval 37.2 to 52.9) |
| 50 | 82.6% (95% interval 76.2 to 88.4) | 73.0% (95% interval 66.3 to 79.7) | 46.2% (95% interval 38.4 to 54.1) |
| 100 | 83.1% (95% interval 77.9 to 88.4) | 73.8% (95% interval 67.4 to 80.2) | 46.5% (95% interval 39.0 to 54.1) |
Oracle the best of all samples, an upper bound on ranking
| Seeds | DockQ ≥ 0.23 | DockQ ≥ 0.49 | DockQ ≥ 0.80 |
|---|---|---|---|
| 1 | 77.0% (95% interval 69.8 to 83.7) | 68.4% (95% interval 59.9 to 76.2) | 47.0% (95% interval 38.4 to 55.2) |
| 2 | 80.9% (95% interval 74.4 to 87.2) | 72.1% (95% interval 64.0 to 79.7) | 50.1% (95% interval 42.4 to 58.1) |
| 5 | 84.1% (95% interval 77.3 to 90.1) | 76.0% (95% interval 68.6 to 82.6) | 53.5% (95% interval 45.9 to 61.0) |
| 10 | 85.7% (95% interval 79.7 to 90.7) | 78.2% (95% interval 71.5 to 84.3) | 55.3% (95% interval 47.7 to 62.8) |
| 20 | 86.5% (95% interval 80.8 to 91.3) | 79.8% (95% interval 73.8 to 85.5) | 56.3% (95% interval 48.3 to 64.0) |
| 50 | 87.5% (95% interval 82.0 to 92.4) | 81.5% (95% interval 75.0 to 87.2) | 57.6% (95% interval 50.0 to 64.5) |
| 100 | 88.4% (95% interval 83.7 to 92.4) | 83.1% (95% interval 77.9 to 88.4) | 58.1% (95% interval 51.1 to 65.1) |
NovaAtom-Lite scales with test-time compute on antibody–antigen: sampling more seeds keeps making the prediction better, over the same 172 antibody–antigen interfaces throughout. Its ranked success rate rises 8.8 points, from 74.3% at one seed to 83.1% at a hundred, and the gain holds at the stricter bars — 8.4 points at DockQ ≥ 0.49 and 5.5 at ≥ 0.80, where accuracy is hardest to buy. Five seeds, the budget the charts above use, already carry 4.0 of those 8.8 points, so a small budget captures much of the benefit and a larger one keeps adding to it. At five seeds the curve is an average over random draws, 78.3%; the single run charted above scored 79.07%. The oracle panel, the best of all samples, shows how much more is within reach: it runs 2.7 points above the ranked curve at one seed and 5.3 at a hundred, and 6.0 to 11.6 at DockQ ≥ 0.80 — samples that are already better than the ranking score picks out.
NovaAtom-Lite on PXMeter
PXMeter[8] is an open-source toolkit for consistent, reproducible evaluation of predicted structures. Its PXM-22to25 dataset collects PDB entries released between January 1, 2022 and December 31, 2025, with low homology to earlier entries; PXM-22to25-AB is its antibody–antigen set. Success is the rate of predictions reaching DockQ ≥ 0.23 under the PXMeter protocol.
Charted: antibody–antigen interfaces in the PXM-22to25-AB set.
- 2022–2025 PDB release window, January 1, 2022 to December 31, 2025
- 528 antibody–antigen PDB entries across PXM-22to25
- 383 clusters, with 1,209 antibody–antigen interfaces in all
PXM-22to25 antibody–antigen
- DockQ ≥ 0.80
- 0.49 ≤ DockQ < 0.80
- 0.23 ≤ DockQ < 0.49
- NovaAtom-Lite, sample 528 entries / 383 clusters
- OpenDDE, sample 494 entries / 364 clusters
- ESMFold2, sample 494 entries / 364 clusters
- Protenix-v1, sample 516 entries / 376 clusters
- Boltz-1, sample 516 entries / 376 clusters
The PXM-22to25 set is drawn from entries released between 2022 and 2025 with low homology to earlier ones, and it is the harder of the two antibody–antigen comparisons here: every model that appears on both scores lower on this one, by 10 to 19 points. NovaAtom-Lite reaches 66.05% against 51.0% for OpenDDE, a 15-point margin, and the ordering below them is the one FoldBench gives. AlphaFold 3 is absent because its authors report no value on this set. Counting units differ between reports — NovaAtom-Lite’s run is scored per cluster over 528 entries in 383 clusters, the baselines over 516 or 494 entries from their own reports[4] — so read the ordering and the size of the gap, not the decimal.
NovaAtom-Lite on Runs N’ Poses
Runs N’ Poses[9] tests whether co-folding methods generalize beyond ligand poses seen in training. Its 2,600 high-resolution protein–ligand systems were released in the PDB between October 6, 2021 and June 5, 2024, after the training cutoff of AlphaFold 3, Chai-1 and Boltz-1[10, 11]. We chart the 2,272 ligands that all five methods predicted, so each line is scored on the same set; success (ligand RMSD < 2 Å, LDDT-PLI > 0.8) is charted against pocket and ligand-pose similarity to the training set.
Charted: the success rate in each similarity bin, with 95% bootstrap intervals. We recomputed AlphaFold 3, Chai-1 and Boltz-1 from the authors’ published predictions[12], and scored NovaAtom-Lite and OpenDDE from our own runs.
- 2021–2024 PDB release window, October 6, 2021 to June 5, 2024
- 2,272 ligands all five methods predicted, of the 2,600 systems
- 8 bins of similarity to the training set, from 0 to 100
Success by similarity to the training set
- NovaAtom-Lite
- AlphaFold 3
- Chai-1
- Boltz-1
- OpenDDE
| Similarity | Ligands | NovaAtom-Lite | AlphaFold 3 | Chai-1 | Boltz-1 | OpenDDE |
|---|---|---|---|---|---|---|
| 0–20 | 63 | 47.6% (95% interval 36.5 to 60.3) | 23.8% (95% interval 14.3 to 34.9) | 9.5% (95% interval 3.2 to 17.5) | 12.7% (95% interval 4.8 to 20.7) | 15.9% (95% interval 7.9 to 25.4) |
| 20–30 | 91 | 40.7% (95% interval 29.7 to 50.5) | 26.4% (95% interval 17.6 to 35.2) | 17.6% (95% interval 9.9 to 25.3) | 7.7% (95% interval 2.2 to 13.2) | 19.8% (95% interval 12.1 to 28.6) |
| 30–40 | 146 | 41.1% (95% interval 32.9 to 48.6) | 28.8% (95% interval 21.2 to 35.6) | 13.7% (95% interval 8.2 to 19.2) | 24.0% (95% interval 17.1 to 30.8) | 28.1% (95% interval 20.6 to 34.9) |
| 40–50 | 257 | 57.2% (95% interval 51.4 to 63.4) | 42.4% (95% interval 36.6 to 48.2) | 29.6% (95% interval 23.7 to 35.0) | 35.4% (95% interval 29.6 to 41.2) | 32.3% (95% interval 26.8 to 37.7) |
| 50–60 | 310 | 66.1% (95% interval 61.3 to 71.6) | 55.8% (95% interval 50.3 to 61.0) | 45.5% (95% interval 40.0 to 51.0) | 45.5% (95% interval 40.0 to 51.3) | 48.1% (95% interval 41.9 to 53.6) |
| 60–70 | 376 | 81.4% (95% interval 77.1 to 85.4) | 67.8% (95% interval 63.3 to 72.3) | 58.5% (95% interval 53.5 to 63.0) | 54.8% (95% interval 50.0 to 59.6) | 64.4% (95% interval 59.8 to 69.2) |
| 70–80 | 364 | 86.3% (95% interval 82.7 to 89.6) | 74.2% (95% interval 70.0 to 78.6) | 70.9% (95% interval 65.9 to 75.5) | 67.0% (95% interval 62.4 to 71.7) | 69.5% (95% interval 64.8 to 73.9) |
| 80–100 | 664 | 91.0% (95% interval 88.7 to 93.2) | 88.2% (95% interval 86.0 to 90.5) | 84.9% (95% interval 82.4 to 87.8) | 80.9% (95% interval 77.9 to 83.7) | 81.2% (95% interval 78.2 to 83.9) |
Each bin groups ligands by how much they resemble the training set, so the left of the chart is the harder test and the right is closer to recall. All five curves rise from left to right, but by different amounts: NovaAtom-Lite’s rises 43 points from the lowest bin to the highest, where AlphaFold 3’s rises 64, OpenDDE’s 65, Boltz-1’s 68 and Chai-1’s 75. The models converge on the right, 91.0% against 88.2% for AlphaFold 3 in the 80–100 bin, and separate on the left: 47.6% against 23.8% for AlphaFold 3 and 15.9% for OpenDDE in the 0–20 bin, and 40.7% against 26.4% and 19.8% in 20–30. Those two bins hold the fewest ligands, 63 and 91 of 2,272, which is why their bands are the widest drawn, where the three on the right hold 376, 364 and 664. Every line is scored on the same ligands, the ones all five methods predicted.
Case studies.
Six FoldBench[3] targets that NovaAtom-Lite predicts correctly and OpenDDE does not, each for a different reason. Each panel is the model’s top-ranked prediction of 25 (five seeds of five samples, ranked by its own score), superposed onto the deposited structure, which is drawn in grey.
Antibody–antigen
Where an antibody binds, and with which loops, is what these three cases test: it is the interface where structure models still differ most, as the FoldBench results above show.
- Deposited structure
- NovaAtom-Lite
- OpenDDE
-
7ZAU Fascin-1 with nanobody 3E11Released September 27, 2023
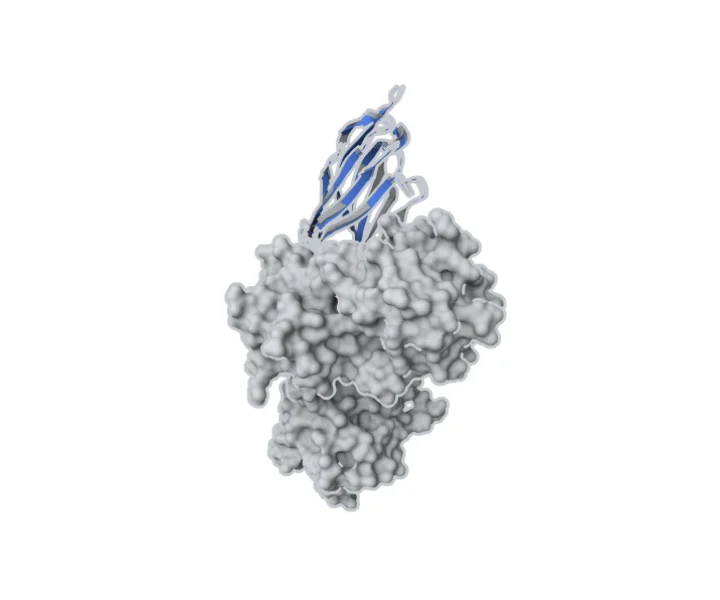
NovaAtom-Lite DockQ 0.805, a success 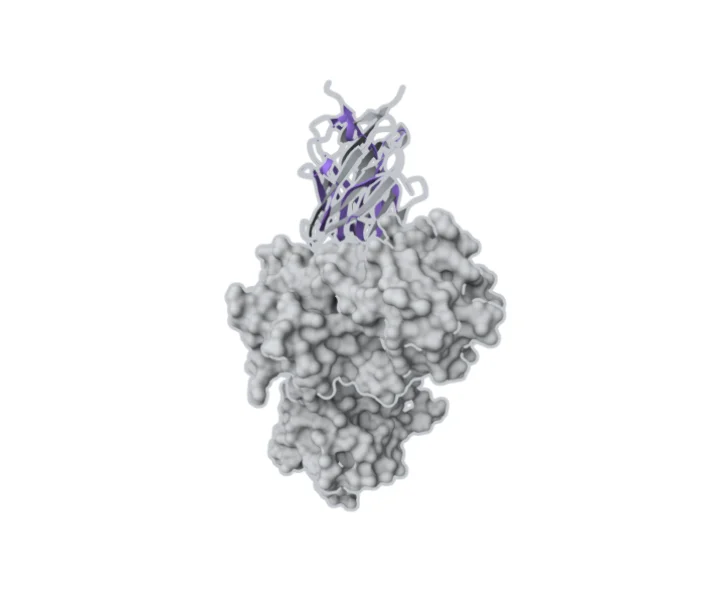
OpenDDE DockQ 0.121, a miss A flat epitope, no anchor
Fascin-1 is an actin-bundling protein of four β-trefoil domains, and 3E11 binds across several of them — 30 epitope residues in eight stretches, a flat interface with nothing to seat the nanobody in. No loop dominates either: H1, H2 and H3 make 5, 5 and 6 contacts. NovaAtom-Lite lands 2.6° from the crystal orientation, with the binding residues 1.4 Å from their place on average; 25 of 25 samples succeed. OpenDDE finds the same face but turns the nanobody 107° about the binding axis.
-
8SLB CorA N-terminal domain with synthetic antibody C12 (Fab)Released June 7, 2023
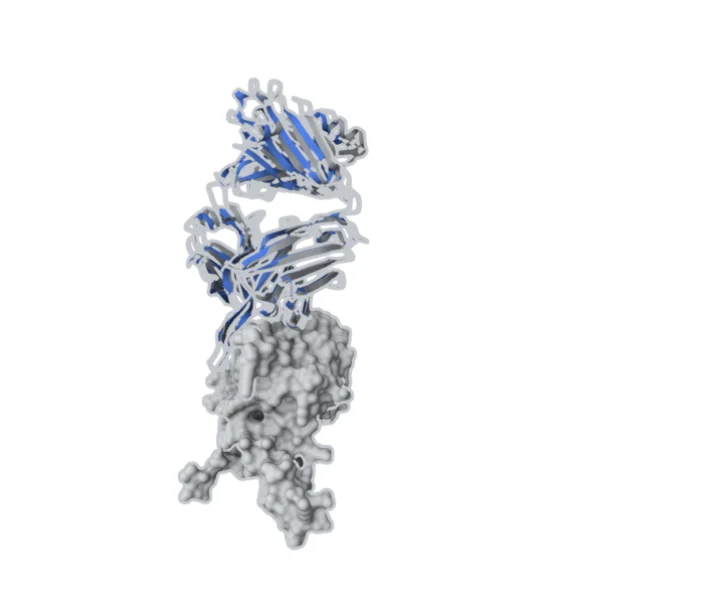
NovaAtom-Lite DockQ 0.710 / 0.787, a success 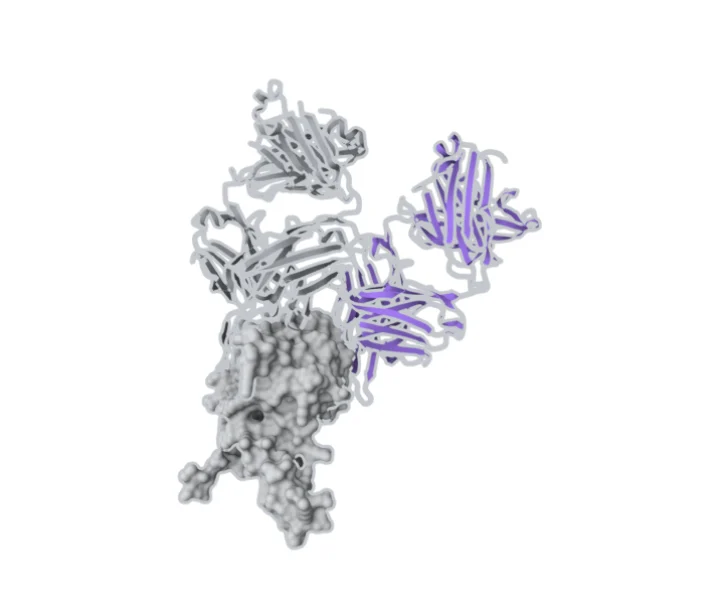
OpenDDE DockQ 0.014 / 0.013, a miss A 23-residue loop decides
C12 is a synthetic Fab, raised by phage display rather than by an immune system, and recognition runs through its CDR-H3 — 23 residues long, making 10 of the contacts to a 35-residue epitope. Build that loop wrong and the docking cannot be right. NovaAtom-Lite builds it to 1.9 Å, all six CDRs between 0.8 and 1.9 Å, and seats the Fab within 3 Å of the crystal pose, recovering 83% of the epitope at 97% precision. OpenDDE’s H3 is off by 8.5 Å and its Fab lands 42 Å away, at ipTM 0.70.
-
8IDO MERS-CoV receptor-binding domain with nanobody VHH-T148Released February 28, 2024
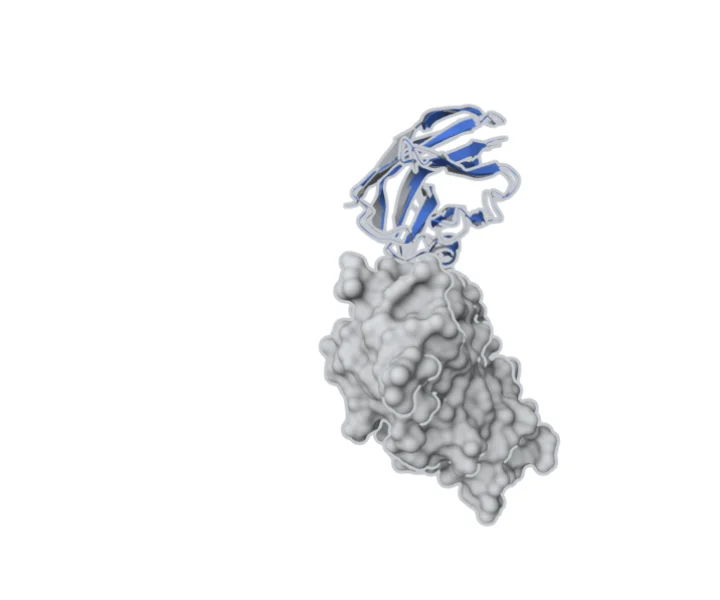
NovaAtom-Lite DockQ 0.839, a success 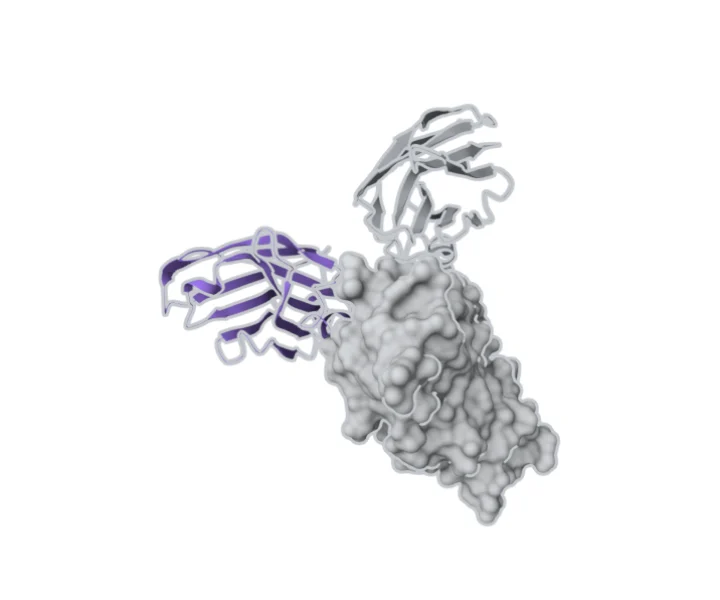
OpenDDE DockQ 0.016, a miss One long loop does the work
VHH-T148 reads the receptor-binding domain with a 22-residue CDR-H3, held in shape by an extra CDR1–CDR3 disulfide; that one loop makes 12 of the 18 epitope contacts. NovaAtom-Lite covers all 18 epitope residues, builds H3 to 0.56 Å, and sits 0.6 Å and 7.9° from the crystal pose; 25 of 25 samples succeed. OpenDDE samples the right pose once, then ranks it fourth.
Protein–ligand
- Deposited structure
- NovaAtom-Lite
- OpenDDE
-
8UN5 KRAS G13D with a switch-II pocket inhibitorReleased December 20, 2023
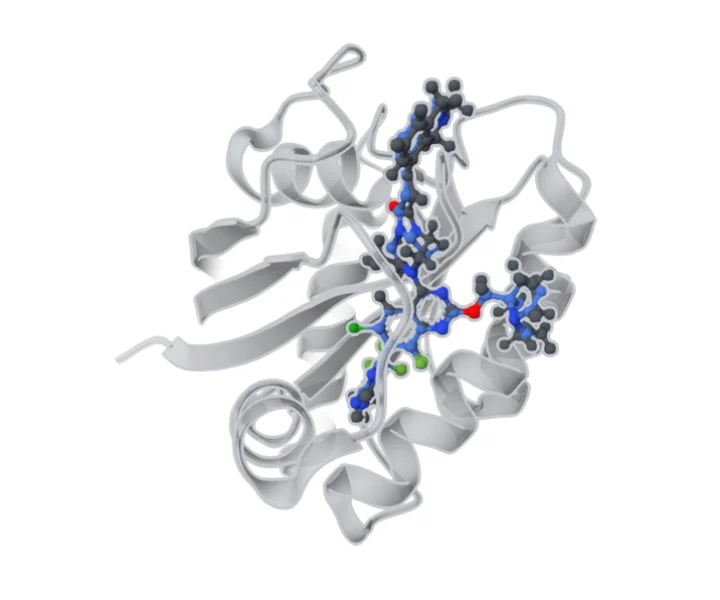
NovaAtom-Lite RMSD 0.98 Å, a success 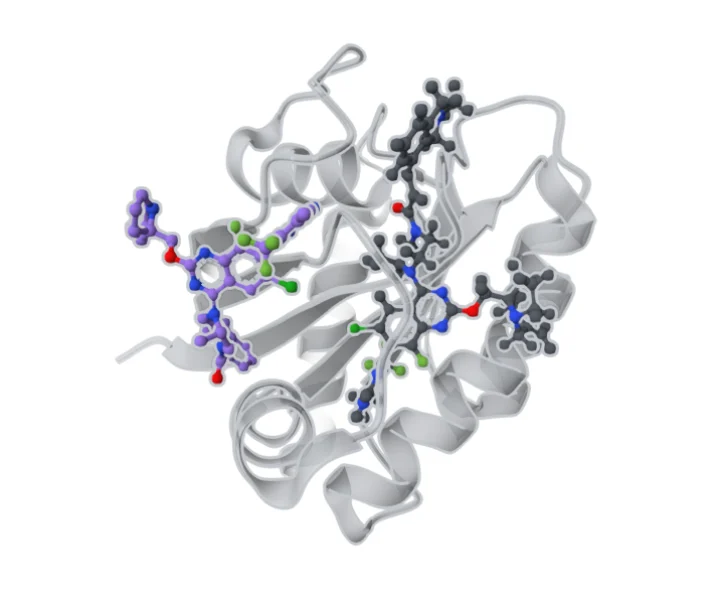
OpenDDE RMSD 17.74 Å, a miss A pocket that must be opened
The switch-II pocket is not formed in unliganded GDP-bound KRAS; it opens only as switch-II (residues 58–76) swings aside for the ligand. A model has to produce the new protein conformation and the ligand pose together, each the precondition for the other, with GDP only 4.1 Å away. NovaAtom-Lite opens it: switch-II within 0.4 to 0.6 Å of the crystal in all 25 samples, all 12 native polar contacts reproduced, no ligand atom closer than 2.2 Å to the protein. OpenDDE leaves it shut (3.3 to 4.8 Å) and its ligand is pushed onto the surface, 17.7 Å away.
-
7FWP Human FABP4 with a furanone inhibitorReleased June 14, 2023
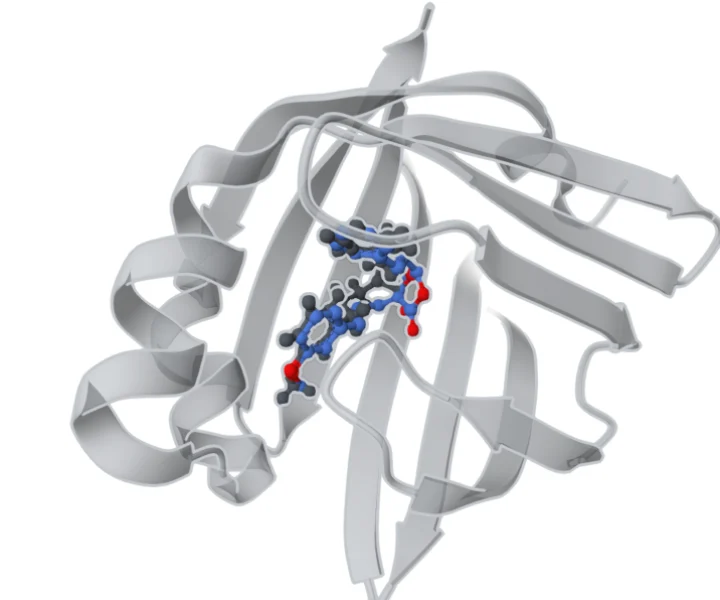
NovaAtom-Lite RMSD 1.27 Å, a success 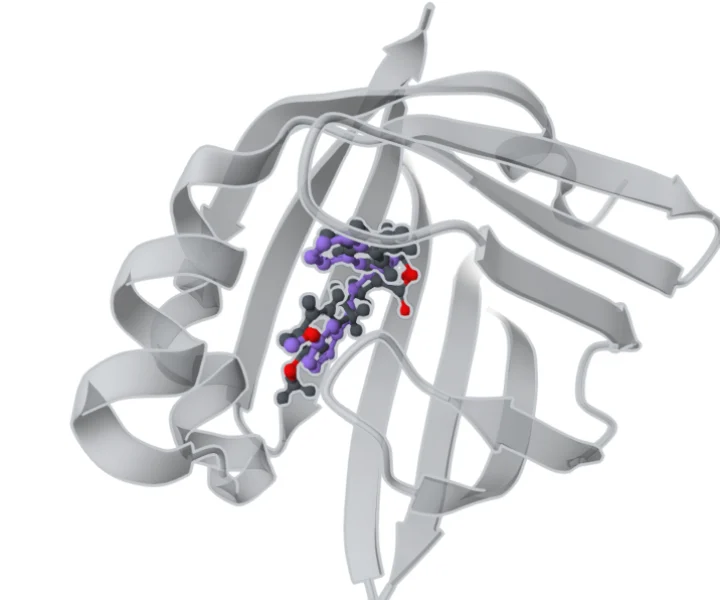
OpenDDE RMSD 2.43 Å, a miss One bond sets the direction
FABP4 encloses its ligand in a closed β-barrel. OT9 is a dumbbell — phenyl, ethyl arm, furanone core, propyl arm, methoxyphenyl — whose two ends are close enough in size that the molecule fits the cavity almost as well reversed. Only one feature fixes the direction: the furanone’s 3-hydroxyl, bonded to Arg126 and Tyr128. NovaAtom-Lite keeps every fragment on its own side in all 25 samples, 0.3 to 1.8 Å from the crystal positions — and does so while parking an extra sulfate on that very anchor. OpenDDE centres the molecule to within 0.7 Å but places the molecule end to end reversed in 23 of its 25 samples.
-
8F8E DCAF1, WDR domain with OICR-8268Released March 1, 2023
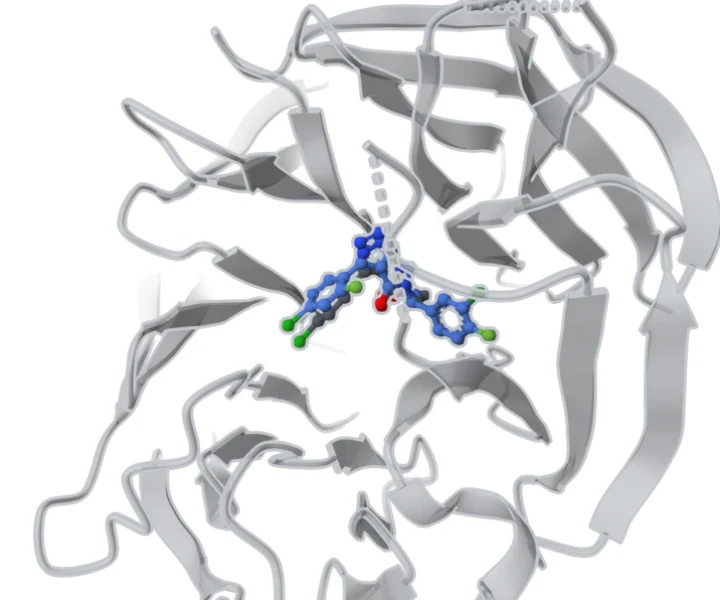
NovaAtom-Lite RMSD 1.48 Å, a success 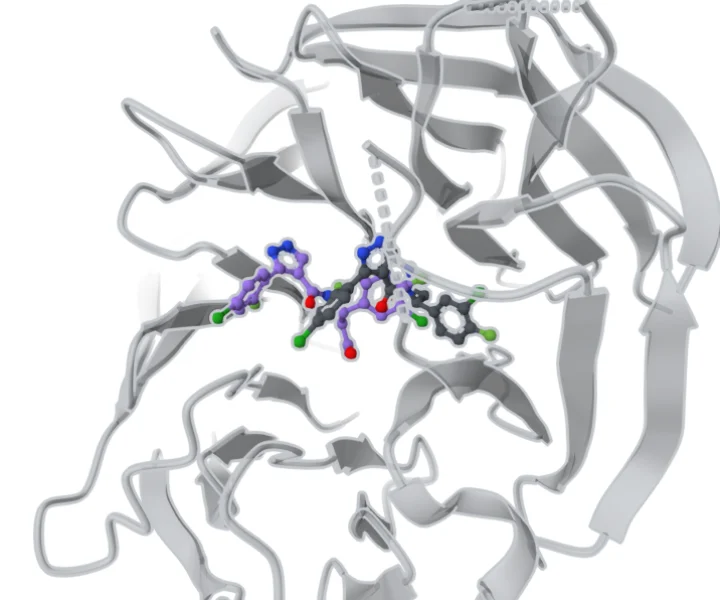
OpenDDE RMSD 5.55 Å, a miss Buried in the channel
OICR-8268 sits in the central channel of DCAF1’s seven-bladed WD40 propeller, completely buried: no ligand atom is more than 4.17 Å from protein, and the 28 pocket residues arrive in ten stretches across its seven blades. With no solvent-exposed face to absorb error, and two near-identical chlorofluorophenyl ends, placement has to be exact. NovaAtom-Lite puts all eight fragments on their own positions in every one of 25 samples, 0.4 to 1.2 Å out, ligand pLDDT 89. OpenDDE builds the channel well — the pocket backbone within 0.60 Å — but never settles: 17 different arrangements across 25 samples.
Confidence that tracks accuracy.
NovaAtom-Lite’s per-residue confidence, pLDDT, follows its actual error closely: confident regions tend to match the experiment, and low-confidence ones are mostly regions the experiment did not resolve, or ones the prediction gets wrong.
pLDDT against observed error, NovaAtom-Lite and OpenDDE
- NovaAtom-Lite (solid bar, filled dot)
- OpenDDE (hatched bar, hollow square)
- Very high, above 90
- Confident, 70 to 90
- Low, 50 to 70
- Very low, below 50
Not resolved in the deposited structure
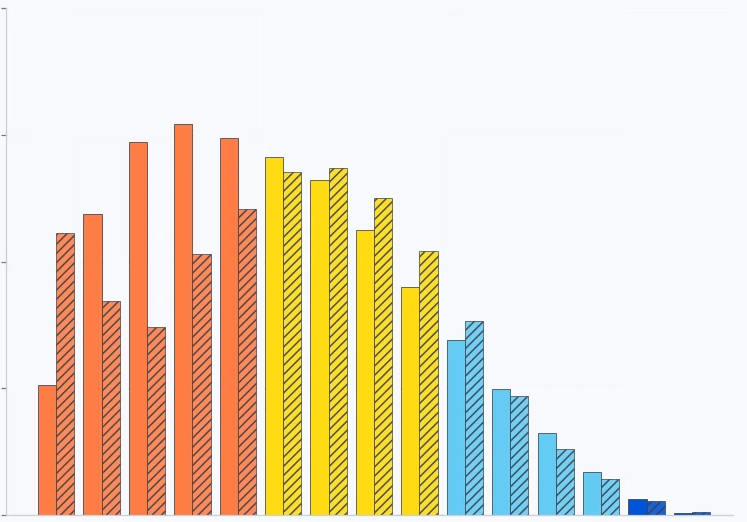
Cα error of the residues the experiment did resolvemarker = median · whisker = 25th–75th percentile
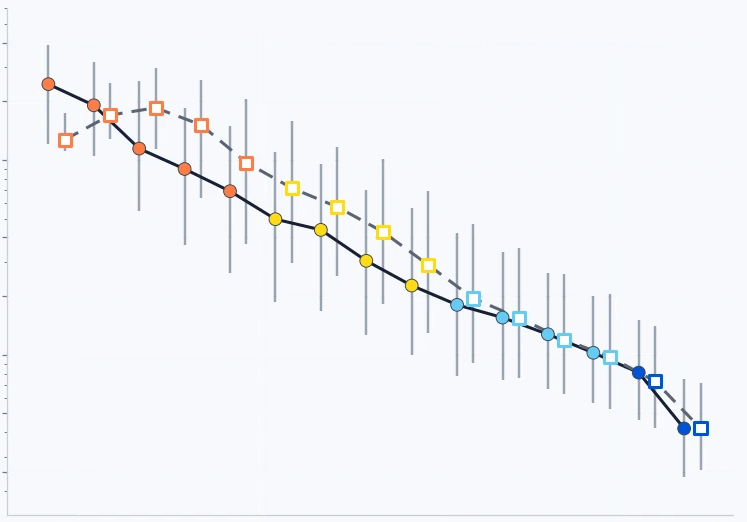
Above pLDDT 70 the two models’ confidence means almost the same thing. Below 70 they part. At the same low pLDDT, the residues OpenDDE places that the experiment did resolve are further off: a median Cα error of 13.5 Å below pLDDT 50, against 9.32 Å for NovaAtom-Lite. And fewer of OpenDDE’s very-low-confidence residues are ones the experiment could not see, 52% against 67%: when NovaAtom-Lite is unsure, the region is more often one the experiment did not resolve.
The structures below are coloured by pLDDT in the standard colours: dark blue above 90, light blue from 70 to 90, yellow from 50 to 70 and orange below 50. Blue marks the regions the model is confident in; yellow and orange flag where it is not. Grey is the deposited structure.
Six cases from the test set, coloured by pLDDT
- Very high, above 90
- Confident, 70 to 90
- Low, 50 to 70
- Very low, below 50
- Deposited structure
Six predictions coloured by pLDDT over the deposited structure in grey: PDB 7QRJ, 9GWT, 8V91, 7UL5, 9QE8 and 9CB3. In each, the very-high-confidence regions lie on the experimental structure, with a median Cα error between 0.27 and 1.12 Å, and the very-low-confidence regions are largely residues the experiment left unresolved (from 5% to 100% of them) or, where it did resolve them, residues the prediction places several ångströms off. Colours: dark blue, pLDDT above 90; light blue, 70 to 90; yellow, 50 to 70; orange, below 50.
-
7QRJ Zamilon virophage protein Zav_19 · trimer
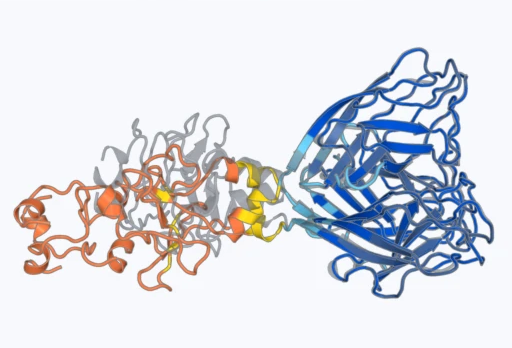
pLDDT < 50: 5% of 155 residues unresolvedthe resolved ones 13.4 Å off · pLDDT > 90: 0.27 Å off
-
9GWT Fab 23ME-00610 · human CD200R1
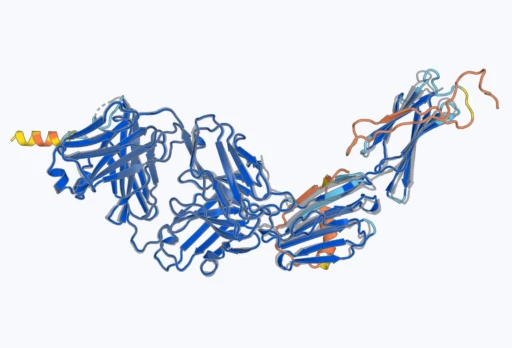
pLDDT < 50: 87% of 78 residues unresolvedthe resolved ones 17.5 Å off · pLDDT > 90: 0.53 Å off
-
8V91 aquaporin-4 tetramer · autoantibody rAb58 Fab · cryo-EM
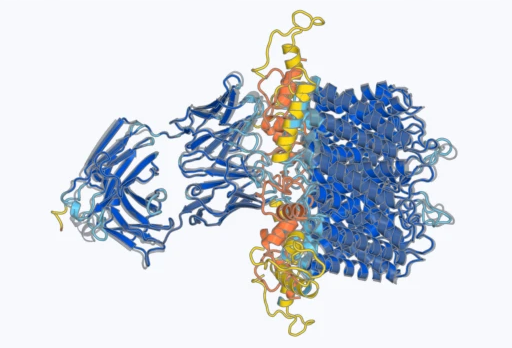
pLDDT < 50: 100% of 189 residues unresolvedpLDDT > 90: 0.55 Å off
-
7UL5 somatostatin receptor 2 (inactive) · nanobody Nb6 · cryo-EM
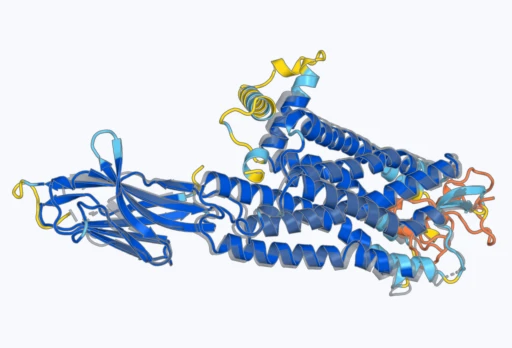
pLDDT < 50: 100% of 72 residues unresolvedpLDDT > 90: 0.77 Å off
-
9QE8 SMAD4 MH2 domain · nanobody NbA7
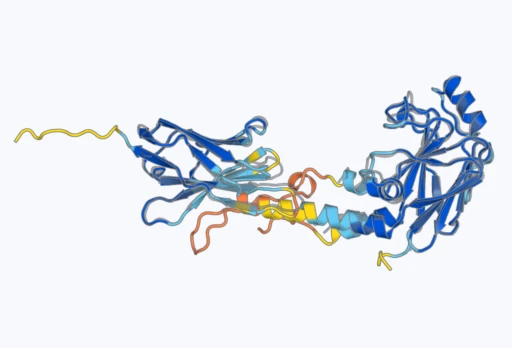
pLDDT < 50: 95% of 41 residues unresolvedthe resolved ones 2.8 Å off · pLDDT > 90: 0.50 Å off
-
9CB3 Cyclin F · E2F1 peptide
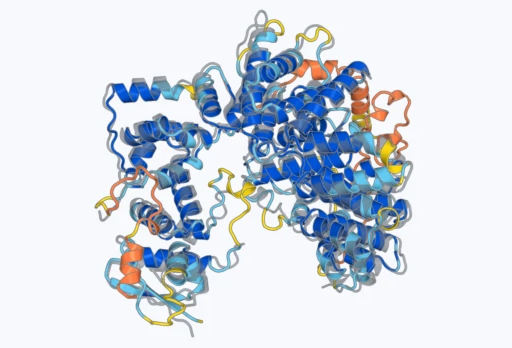
pLDDT < 50: 100% of 108 residues unresolvedpLDDT > 90: 1.12 Å off
In practice, this is how the confidence is used: to decide which parts of a prediction to rely on, and which to check before taking a structure to the wet lab. NovaAtom-Lite also ranks its own samples; the test-time scaling figure above shows how close its top-ranked pick comes to the best of them.
Materials shared with this release.
Shared with this release so the evaluation can be checked.
Internal benchmark
- Purpose
- [purpose]
- Scope
- [public scope]
- Method
- [method / how to run]
- License
- [license]
- Link
- [https link]
Kernel improvements
- Purpose
- [purpose]
- Scope
- [public scope]
- Method
- [method / how to run]
- License
- [license]
- Link
- [https link]
References
- Abramson, J. et al. Accurate structure prediction of biomolecular interactions with AlphaFold 3. Nature 630, 493–500 (2024). doi.org/10.1038/s41586-024-07487-w
- Isomorphic Labs Team. Accurate Predictions of Novel Biomolecular Interactions with IsoDDE. Technical report, Zenodo 10.5281/zenodo.19699685 (February 2026); FoldBench values from its Table 1. doi.org/10.5281/zenodo.19699685
- Xu, S. et al. Benchmarking all-atom biomolecular structure prediction with FoldBench. Nature Communications (2025). doi.org/10.1038/s41467-025-67127-3
- OpenDDE Project, Aureka AI Research. Folding, Reasoning, and Scaling with Open-source Drug Discovery Engine (OpenDDE technical report). arXiv:2607.03787 (2026). arxiv.org/abs/2607.03787
- Zhou, Y., Lu, C. et al. (ByteDance Seed). SeedFold: Scaling Biomolecular Structure Prediction. arXiv:2512.24354 (2025), Table 3. arxiv.org/abs/2512.24354
- Candido, S. et al. Language Modeling Materializes a World Model of Protein Biology. bioRxiv 10.64898/2026.06.03.729735 (2026). www.biorxiv.org/content/10.64898/2026.06.03.729735v1
- ByteDance Seed. Protenix-v1: Toward High-Accuracy Open-Source Biomolecular Structure Prediction. bioRxiv 10.64898/2026.02.05.703733 (2026), Fig. 1a. www.biorxiv.org/content/10.64898/2026.02.05.703733v3
- Ma, W. et al. From Dataset Curation to Unified Evaluation: Revisiting Structure Prediction Benchmarks with PXMeter. bioRxiv 10.1101/2025.07.17.664878 (2025); the PXM-22to25 dataset, with the toolkit at github.com/bytedance/PXMeter. doi.org/10.1101/2025.07.17.664878
- Škrinjar, P. et al. Evaluating generalization in protein–ligand cofolding methods. Nature Structural & Molecular Biology 33, 782–794 (2026). doi.org/10.1038/s41594-026-01797-5
- Chai Discovery. Chai-1: Decoding the molecular interactions of life. bioRxiv 10.1101/2024.10.10.615955 (2024). doi.org/10.1101/2024.10.10.615955
- Wohlwend, J. et al. Boltz-1: Democratizing Biomolecular Interaction Modeling. bioRxiv 10.1101/2024.11.19.624167 (2024). doi.org/10.1101/2024.11.19.624167
- Runs N’ Poses: dataset and published predictions. Zenodo (2025). doi.org/10.5281/zenodo.14794785
Where to use NovaAtom-Lite.
From your own code through the Geodesic API, or with no code at all in NovaDDE.
- Geodesic APIRun NovaAtom-Lite from your own code: submit a job, follow its progress and download the predicted structure over HTTPS.Go to the API
- NovaDDEUse NovaAtom-Lite in Geodesic’s AI-native platform for scientific reasoning and drug discovery, alongside our other models and tools, with no code to write.Go to NovaDDE
In the long run, we build models like NovaAtom to make AGI improve human health.